
May The Fourth Be with Us
This is an introductory post testing that I have everything setup correctly and a sensible workflow.
Veiw of this blog
I want to be able to write about the statistics and R related things that come up in the course of my work. Mainly this blog will serve as an aid to my coworkers. I typically have to make documents that are shorter than a formal white paper, but need to be more extensive than an email or a conversation. Hopefully, this will bridge that gap.
Quick Demo
Trying to insert a basic table and plot
summary(cars)## speed dist
## Min. : 4.0 Min. : 2.00
## 1st Qu.:12.0 1st Qu.: 26.00
## Median :15.0 Median : 36.00
## Mean :15.4 Mean : 42.98
## 3rd Qu.:19.0 3rd Qu.: 56.00
## Max. :25.0 Max. :120.00See if I can also embed plots, for example:
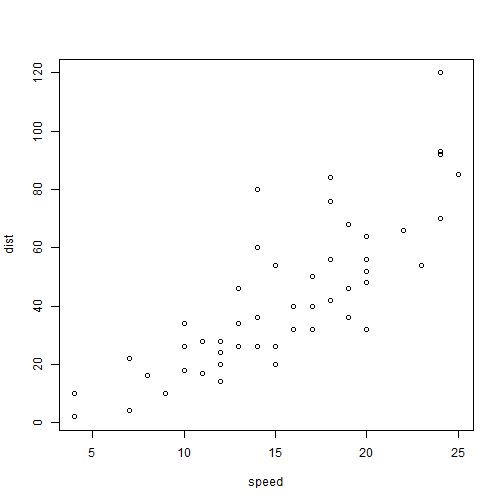
Note that the echo = FALSE parameter was added to the code chunk to prevent printing of the R code that generated the plot.
Written on May 4, 2015